FreightWaves has partnered with Tai to bring SONAR to you! If you are an existing SONAR customer with a SONAR API subscription to our Capacity and/or FW TRAC data, simply use your existing API credentials/ token to start accessing the data. SONAR is the only platform with a complete view of everything moving in the global freight economy. Exclusive insights and actionable intelligence across all modes. Know the market today and forecast the future.
FreightWaves’ Capacity Lane Scores provide users unique insight into the current capacity trends on a given lane. Measuring capacity is a key element to maximizing margins/transactions for a broker, utilization for a carrier, and minimizing service and budgetary failures for shippers. The capacity lane score is a measure of the origin and destination market capacities and shows you how capacity is tightening or loosening by combining tender rejection rates and the market balance of inbound and outbound loads. Users will be able to see which lanes have the most significant tightening or loosening conditions, leading to lower costs and improved profitability.
.jpg?width=855&name=tai_sonar%20(1).jpg)
” Sonar is definitely making a splash in the broker market. The ability to accurately predict truckload rates has become more and more necessary in this constrained market. Brokers are getting pressure to respond to spot quotes faster and a rating tool like sonar gives them market intelligence they can trust. Sonar shows you if capacity is tightening or loosening, which is critical for carrier reps. It allows you to see if the rates you are getting are the best you can get in a tightening market, or if you should wait for a better rate because capacity is loosening. “ says Sean McGillicuddy, VP of Sales & Marketing at Tai.
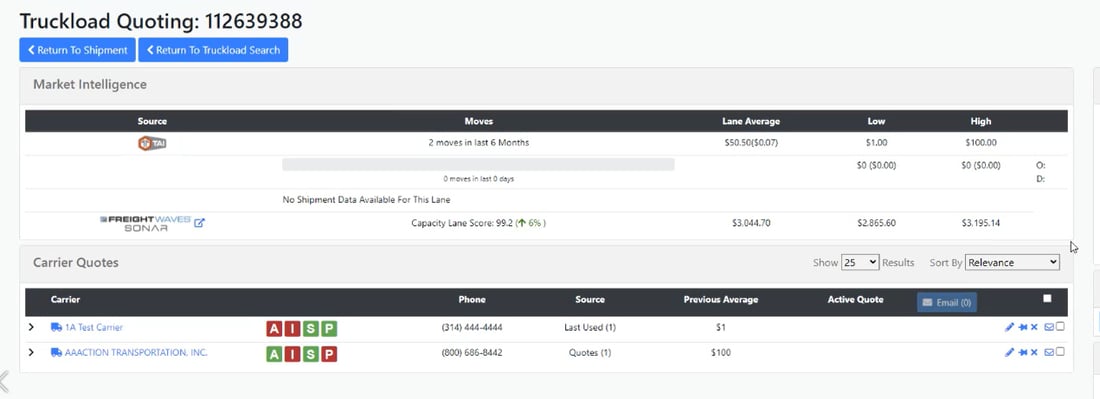
The capacity lane score ranges from 0-100 and reflects the market at the time of booking . A high score indicates that capacity is tight, and a low score indicates that capacity is loose. Increasing lane scores indicate tightening capacity with upward pressure on spot rates, and decreasing lane scores indicate loosening capacity with downward pressure on spot rates. Use your TMS dashboard to view the market Charts to see historical trends and forecast the future by comparing datasets. This data includes booked prices, origin, destination and equipment types on shipments recorded within the last 24 hours to provide better insight into freight pricing when negotiating.
Example of High Capacity Lane Score
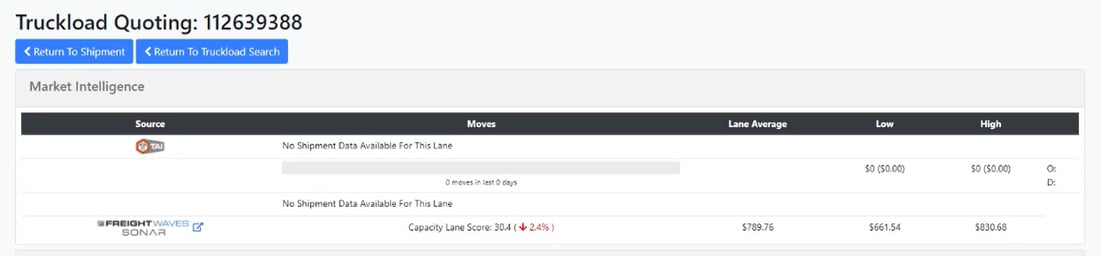
Example Low Capacity Lane Score
The spot rates are generated from FreightWaves TRAC which collects data daily from a consortium of key market-driving companies adhering to a standardized protocol. FreightWaves TRAC Spot Rate methodology uses data from when the load is covered to provide better insight into freight pricing and negotiating. The rates displayed represent the low (33rd percentile), median, and high (67th percentile) rates for a given lane and update daily.
To gain access to SONAR data or learn more about FreightWaves TRAC or our capacity datasets, please please contact us at cs@freightwaves.com.